Fair Value MSThis indicator introduces rigid rules to familiar concepts to better capture and visualize Market Structure and Areas of Support and Resistance in a way that is both rule-based and reactive to market movements.
Typical "Market Structure" or "Zig-Zag" methods determine swing points based on fixed thresholds (length or percentage). While this does provide rigid structure, the results may be lagging or confusing due to the timing, since it is fixed to static parameters.
I believe the concept of Fair Value Gaps can solve this problem.
As you will notice, there are no length settings in this indicator.
> FVG Market Structure
Fair Value Gaps are a well known concept used to indicate directional intent, forming when price moves aggressively in one direction, leaving behind an imbalance between buyers and sellers. While the term FVG was popularized by ICT, the underlying concept predates them, known historically as imbalances, inefficiencies, or liquidity voids in institutional trading.
Note: For simplicity, in this indicator they'll be called FVGs.
By reading into this, we are able to clearly and rigidly define market structure simply by "looking" at the chart, using objective price events rather than subjective interpretation, or lengths.
By using FVGs to determine structure direction, the length, and speed of identification lies entirely on the market. If an FVG Down occurs immediately after a New Higher High forms, it is reasonable to assume there was a seller at that point, so the script would indicate a New Swing High.
The script is NOT stuck, waiting for a % retrace, or # bars to pass to identify it as such.
Sometimes the market is in a steady trend in a single direction and no FVGs form; therefore, no structure forms. -> Why would we try to impose structure on a clear trend?
Ultimately, the FVG Structure Method uses real reactions from the market to determine Market structure, and is not fixed to specific parameters.
As with other market structure indicators, "Market Structure Breaks" are still identifiable when price moves outside the most recent swing points.
These are helpful to indicate larger direction. In the following section you will see how these help us determine when we should start the search for an "Area of Interest (AOI)".
> Areas of Interest (AOIs)
"Area of Interest (AOI)" is a generalized term, and could refer to many types of zones you might recognize under different names. While the AOIs in this indicator are specialized in their own way, I have chosen to simply use the term "Area of Interest" because it’s more important to understand how they behave and why they exist than to focus on what they’re called.
The goal of an AOI is to point out reasonable areas where buyers or sellers may be staging, as is typical with support and resistance.
In order to reasonably identify these areas, we look for cause and effect relationships. When considering these relationships, it's easier to understand the placement of the points to define each zone.
(Buyer Examples)
Cause: Strong Buyers step in at Swing Low
Effect: Fair Value Gap Forms
Cause: Sustained Buying Pressure
Effect: Market Structure Breaks
In this example, The zone is drawn from the Swing Low, to the Bottom of the FVG closest to the swing point.
In theory, the participation at the swing point was strong and aggressive enough to create the FVG imbalance. Which then found acceptance and continued into a Market Structure Break. So with these AOIs, we are trying to locate the aggressive Buyers or Sellers which were positioned BEFORE the FVG.
These Zones are intended to act as areas to look for reactions from market participants, to judge where price may be going. When revisiting these zones, we look for a reaction or a break, to further provide us information to if the buyers or sellers are still there.
As seen in the screenshot above, The information we gain is not from the creation of these zones, but from the behavior we witness when these zones are revisited.
Technical Note: In this indicator, Market Structure Breaks are only considered when price closes outside the recent swing points. Wicks are not considered as confirmation, therefore are not used to detect structural breaks.
Inside each AOI you can optionally display a readout of the volume which accumulated during the time starting at the swing point and going until the closing bar of the FVG.
Note: We are counting volume until the closing bar of the FVG since the FVG is a 3 bar formation, and aggressive volume is required throughout to create the imbalance.
There are multiple FVGs that typically occur in a single direction, but we do not look to every single one to be indicative of structure, only the first FVG in the opposite direction of the previous direction (which is determined by previous FVGs)
You will probably notice, the AOIs do not form from the closest swing or FVG to the break, this is because we are targeting larger directional changes to draw these AOIs from.
Since they do not always happen perfectly every time, the AOI formation waits for an FVG to occur AND a Market structure break to happen. One without the other will result in no Zone displaying.
> Reflection Lines
While they may seem slightly redundant, Reflection Lines serve as reminders of previous support and resistance pivots. They are drawn at the same Pivots where and AOI is formed, and extend beyond the mitigation of the AOI.
These lines are often points of price to look for "Support Flips", a re-test pattern where price trades through previous support (or resistance) then returns to it and rejects, continuing into a larger move or trend.
Their namesake is based on the behavior of price, "reflecting" at these levels.
The Reflection lines are simple and change color based on price's location.
If price is above, we would typically look to a reflection line in with support in mind.
As a basic filter, these lines use an average price to determine their color, this way they will not change their color as frequently in choppy situations.
> Session Start/End Lines
For analysis purposes and trade review, it is helpful to analyze with context.
For that reason, I have implemented start and end session lines into the indicator, these are helpful when reviewing historical charts to not provide additional context.
By default, they are set to the NYSE Session, but can be changed to fit any needs.
These lines are not advanced, and simply draw a line as the chart passes the start and end of the sessions. It's very likely that you may need to adjust the session for your specific needs.
Note: The Timezone can be adjusted within the code if needed. By Default, the indicator uses "America/New_York" Timezone.
> Conclusion
If you’ve ever felt like your structure tools were confusing or lagging, drawing zones too late, or zones that simply don't make sense, this should feel like a breath of fresh air.
By removing arbitrary length settings and instead using FVGs to define structure and as a basis for AOIs, you're getting a more accurate look at what price is doing and where it's reacting from.
This indicator is rule-based, reactive, and aims to keep things logical without fluff or false confidence.
Enjoy!
ابحث في النصوص البرمجية عن "swing high"

Fractal Pullback Market StructureFractal Pullback Market Structure
Author: The_Forex_Steward
License: Mozilla Public License 2.0
The Fractal Pullback Market Structure indicator is a sophisticated price action tool designed to visualize internal structure shifts and break-of-structure (BoS) events with high accuracy. It leverages fractal pullback logic to identify market swing points and confirm whether a directional change has occurred.
This indicator detects swing highs and lows based on fractal behavior, drawing zigzag lines to connect these key pivot points. It classifies and labels each structural point as either a Higher High (HH), Higher Low (HL), Lower High (LH), or Lower Low (LL). Internal shifts are marked using triangle symbols on the chart, distinguishing bullish from bearish developments.
Break of Structure events are confirmed when price closes beyond the most recent swing high or low, and a horizontal line is drawn at the breakout level. This helps traders validate when a structural trend change is underway.
Users can configure the lookback period that defines the sensitivity of the pullback detection, as well as a timeframe multiplier to align the logic with higher timeframes such as 4H or Daily. There are visual customization settings for the zigzag lines and BoS markers, including color, width, and style (solid, dotted, or dashed).
Alerts are available for each key structural label—HH, HL, LH, LL—as well as for BoS events. These alerts are filtered through a selectable alert mode that separates signals by timeframe category: Low Timeframe (LTF), Medium Timeframe (MTF), and High Timeframe (HTF). Each mode allows the user to receive alerts only when relevant to their strategy.
This indicator excels in trend confirmation and reversal detection. Traders can use it to identify developing structure, validate internal shifts, and anticipate breakout continuation or rejection. It is particularly useful for Smart Money Concept (SMC) traders, swing traders, and those looking to refine entries and exits based on price structure rather than lagging indicators.
Visual clarity, adaptable timeframe logic, and precise structural event detection make this tool a valuable addition to any price action trader’s toolkit.

Price Ranged FVG📌 Price Ranged FVG
Is a clean and efficient tool designed to detect Fair Value Gaps (FVGs) with adjustable filters and structural context. It’s especially useful for traders looking to filter out insignificant gaps and focus on high-probability areas, particularly around swing breaks or structural shifts.
🧠 What is a Fair Value Gap (FVG)?
A Fair Value Gap appears when there’s a price imbalance between candles — typically after a strong move — where the market skips over certain price levels without trading there. These zones can act as potential areas for price to return to (mean reversion), or serve as support/resistance depending on market structure.
🔍 FVG Detection Types
You can choose between three different detection modes under the "FVG Detection" input:
Same Type: Only detects FVGs where the last 3 candles are in the same direction (all bullish or all bearish).
All: Detects any FVG, regardless of candle direction.
Twin Close: Detects FVGs only when the last two candles are in the same direction and close accordingly — offering a stricter confirmation.
🎯 FVG % Filters
To filter out noise or insignificant gaps, this indicator includes:
Minimum FVG % Filter: Ignores FVGs smaller than your specified percentage of the current close.
Maximum FVG % Filter: Ignores overly large gaps that may be unreliable or caused by anomalies.
These filters help focus on relevant FVGs that are more likely to act as reaction zones.
🏛 Structural Context (Swing Highs and Lows)
The indicator plots swing highs and swing lows with dots to provide structure-based context:
Set Swing Strength to 3 for detecting internal structure (shorter-term moves).
Use a higher setting like 5 to focus on external structure (more significant highs/lows).
These levels can help you determine whether an FVG is forming within a consolidation, breakout, or key structural transition.
✅ Use Case (My Personal Workflow)
I personally use this indicator to:
Filter out weak or irrelevant FVGs using the % filters.
Watch for price interaction at swing breaks — especially when an FVG aligns with a break in internal or external structure.
Refine entry and exit planning in confluence with other tools or strategies.
⚠️ Disclaimer
This indicator is not financial advice. It is a technical analysis tool intended to support your own decision-making process. Always do your own research and risk management.

Multi-Timeframe PivotDescription:
This script provides an advanced tool for multi-timeframe pivot point
analysis. It identifies swing points based on a candle's relationship to
its neighbors. The default strength settings of 1 align with the Inner
Circle Trader (ICT) concept of market structure.
The ICT concept defines a swing point based on a simple 3-candle pattern:
- A swing high is a candle where the candles to the immediate left and right
both have lower highs.
- A swing low is a candle where the candles to the immediate left and right
both have higher lows.
A key feature is its ability to accurately calculate and translate pivot
points from up to five higher timeframes (HTFs) and display them
precisely on a lower timeframe (LTF) chart.
NOTE: This indicator is designed to show HTF data on an LTF chart.
If you select a timeframe in the settings that is lower than your
current chart's timeframe, it will show pivots for the chart's
timeframe instead.
Core Features:
- Up to five independent higher timeframes.
- Per-timeframe customization for pivot strength (left/right bars) and color.
- Optional "Watchlines" that project the price of each pivot forward,
complete with a text label identifying the timeframe.
- An optional "Alignment Model" that colors the background when price is
aligned across all active timeframes (requires at least 2 TFs to be enabled).
Default State:
For a clean initial application, the Watchlines and Alignment Model features
are disabled by default but can be enabled in the settings.

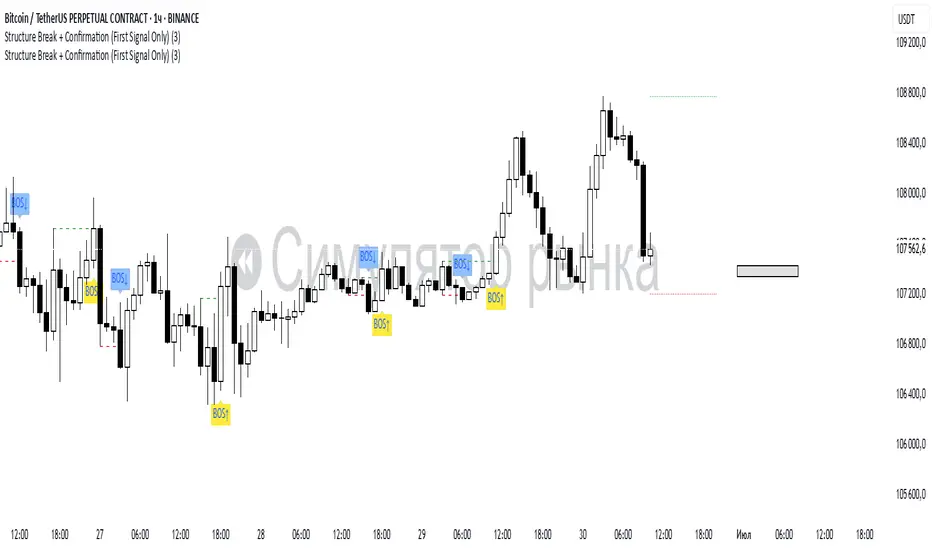
Structure Break + Confirmation (First Signal Only)Swing Detection:
A Swing High is detected when the high of the central candle (based on a lookback period) is greater than the highs of the candles before and after.
A Swing Low is detected when the low of the central candle is lower than the lows of the candles before and after.
Break of Structure (BOS):
A BOS Up is confirmed when a candle closes above the most recent swing high (with a body close).
A BOS Down is confirmed when a candle closes below the most recent swing low.
Confirmation (CONF):
A CONF Up is triggered when price makes a new high after a BOS Up.
A CONF Down is triggered when price makes a new low after a BOS Down.
Only the first confirmation after a BOS is plotted.
Visuals:
Cross marks (×) are plotted at swing points.
BOS signals are shown with green (up) and red (down) labels.
CONF signals are shown with lime (up) and orange (down) triangle markers.
Dotted lines are drawn at the levels of broken swing highs/lows.
BOS mark-out (by Lumiere)Advanced BOS Detection with Strict Swing Confirmation
This indicator implements BOS detection with several unique features:
🔹 Dual-Candle Swing Validation - Unlike most BOS indicators that use single candle swings, this uses a two-candle confirmation for swing highs/lows, analyzing both the candle wicks and body transitions.
🔹 Directional Lock System - Implements a state machine that prevents duplicate signals until an opposite-direction BOS occurs, reducing noise.
🔹 Precision Wick Analysis - Compares wicks between the reversal candle and confirmation candle to identify the true swing point.
🔹 Real-Time Update & Live Market Adaptation – The indicator continuously monitors price action and instantly updates BOS signals as new candles form, ensuring you never miss a BOS.
How It Differs From Other BOS Indicators:
Most public BOS indicators use simple HH/HL or LH/LL detection.
Many don't implement the directional locking mechanism.
Few use the two-candle wick comparison approach.
Wick-Based Precision uses the extreme wicks of two candles (not just the body).
Strict Confirmation requires a close beyond the swing point (no "wick breaks" counted).
Usage Examples:
🟦 Bullish BOS:
A green candle closes, followed by a red candle. This will be the new high, and if the next candle closes above the highest wick of those two, it will be a BOS (only if we had a bearish BOS before)
🟥 Bearish BOS:
A red candle closes, followed by a green candle. This will be the new low, and if the next candle closes below the lowest wick of those two, it will be a BOS (only if we had a Bullish BOS before)

(Mustang Algo) Stochastic RSI + Triple EMAStochastic RSI + Triple EMA (StochTEMA)
Overview
The Stochastic RSI + Triple EMA indicator combines the Stochastic RSI oscillator with a Triple Exponential Moving Average (TEMA) overlay to generate clear buy and sell signals on the price chart. By measuring RSI overbought/oversold conditions and confirming trend direction with TEMA, this tool helps traders identify high-probability entries and exits while filtering out noise in choppy markets.
Key Features
Stochastic RSI Calculation
Computes a standard RSI over a user-defined period (default 50).
Applies a Stochastic oscillator to the RSI values over a second user-defined period (default 50).
Smooths the %K line by taking an SMA over a third input (default 3), and %D is an SMA of %K over another input (default 3).
Defines oversold when both %K and %D are below 20, and overbought when both are above 80.
Triple EMA (TEMA)
Calculates three successive EMAs on the closing price with the same length (default 9).
Combines them using TEMA = 3×(EMA1 – EMA2) + EMA3, producing a fast-reacting trend line.
Bullish trend is identified when price > TEMA and TEMA is rising; bearish trend when price < TEMA and TEMA is falling; neutral/flat when TEMA change is minimal.
Signal Logic
Strong Buy: Previous bar’s Stoch RSI was oversold (both %K and %D < 20), %K crosses above %D, and TEMA is in a bullish trend.
Medium Buy: %K crosses above %D (without requiring oversold), TEMA is bullish, and previous %K < 50.
Weak Buy: Previous bar’s %K and %D were oversold, %K crosses above %D, TEMA is flat or bullish (not bearish).
Strong Sell: Previous bar’s Stoch RSI was overbought (both %K and %D > 80), %K crosses below %D, and TEMA is bearish.
Medium Sell: %K crosses below %D (without requiring overbought), TEMA is bearish, and previous %K > 50.
Weak Sell: Previous bar’s %K and %D were overbought, %K crosses below %D, TEMA is flat or bearish (not bullish).
Visual Elements on Chart
TEMA Line: Plotted in cyan (#00BCD4) with a medium-thick line for clear trend visualization.
Buy/Sell Markers:
BUY STRONG: Lime label below the candle
BUY MEDIUM: Green triangle below the candle
BUY WEAK: Semi-transparent green circle below the candle
SELL STRONG: Red label above the candle
SELL MEDIUM: Orange triangle above the candle
SELL WEAK: Semi-transparent orange circle above the candle
Candle & Background Coloring: When a strong buy or sell signal occurs, the candle body is tinted (semi-transparent lime/red) and the chart background briefly flashes light green (buy) or light red (sell).
Dynamic Support/Resistance:
On a strong buy signal, a green dot is plotted under that bar’s low as a temporary support marker.
On a strong sell signal, a red dot is plotted above that bar’s high as a temporary resistance marker.
Alerts
Strong Buy Alert: Triggered when Stoch RSI is oversold, %K crosses above %D, and TEMA is bullish.
Strong Sell Alert: Triggered when Stoch RSI is overbought, %K crosses below %D, and TEMA is bearish.
General Buy Alert: Triggered on any bullish crossover (%K > %D) when TEMA is not bearish.
General Sell Alert: Triggered on any bearish crossover (%K < %D) when TEMA is not bullish.
Inputs
Stochastic RSI Settings (group “Stochastic RSI”):
K (smoothK): Period length for smoothing the %K line (default 3, minimum 1)
D (smoothD): Period length for smoothing the %D line (default 3, minimum 1)
RSI Length (lengthRSI): Number of bars used for the RSI calculation (default 50, minimum 1)
Stochastic Length (lengthStoch): Number of bars for the Stochastic oscillator applied to RSI (default 50, minimum 1)
RSI Source (src): Price source for the RSI (default = close)
TEMA Settings (group “Triple EMA”):
TEMA Length (lengthTEMA): Number of bars used for each of the three EMAs (default 9, minimum 1)
How to Use
Add the Script
Copy and paste the indicator code into TradingView’s Pine Editor (version 6).
Save the script and add it to your chart as “Stochastic RSI + Triple EMA (StochTEMA).”
Adjust Inputs
Choose shorter lengths for lower timeframes (e.g., intraday scalping) and longer lengths for higher timeframes (e.g., swing trading).
Fine-tune the Stochastic RSI parameters (K, D, RSI Length, Stochastic Length) to suit the volatility of the instrument.
Modify TEMA Length if you prefer a faster or slower moving average response.
Interpret Signals
Primary Entries/Exits: Focus on “BUY STRONG” and “SELL STRONG” signals, as they require both oversold/overbought conditions and a confirming TEMA trend.
Confirmation Signals: Use “BUY MEDIUM”/“BUY WEAK” to confirm or add to an existing position when the market is trending. Similarly, “SELL MEDIUM”/“SELL WEAK” can be used to scale out or confirm bearish momentum.
Support/Resistance Dots: These help identify recent swing lows (green dots) and swing highs (red dots) that were tagged by strong signals—useful to place stop-loss or profit-target orders.
Set Alerts
Open the Alerts menu (bell icon) in TradingView, choose this script, and select the desired alert condition (e.g., “BUY Signal Strong”).
Configure notifications (popup, email, webhook) according to your trading workflow.
Notes & Best Practices
Filtering False Signals: By combining Stoch RSI crossovers with TEMA trend confirmation, most false breakouts during choppy price action are filtered out.
Timeframe Selection: This indicator works on all timeframes, but shorter timeframes may generate frequent signals—consider higher-timeframe confirmation when trading lower timeframes.
Risk Management: Always use proper position sizing and stop-loss placement. An “oversold” or “overbought” reading can remain extended for some time in strong trends.
Backtesting/Optimization: Before live trading, backtest different parameter combinations on historical data to find the optimal balance between sensitivity and reliability for your chosen instrument.
No Guarantee of Profits: As with any technical indicator, past performance does not guarantee future results. Use in conjunction with other forms of analysis (volume, price patterns, fundamentals).
Author: Your Name or Username
Version: 1.0 (Pine Script v6)
Published: June 2025
Feel free to customize input values and visual preferences. If you find bugs or have suggestions for improvements, open an issue or leave a comment below. Trade responsibly!

ZigZag ProZigZag Pro is a precise market structure indicator that automatically detects two independent ZigZag patterns and highlights breakouts whenever significant highs or lows are breached.
The indicator calculates two separate ZigZag structures in real time. ZigZag1 captures the broader market swings and is ideal for trend or swing trading. ZigZag2 is optional and reacts more quickly – perfect for intraday or scalping setups. Both layers are fully customizable in terms of depth, color, and line width.
What makes this tool especially useful: whenever a previous swing high (for long trades) or swing low (for short trades) is broken, the indicator draws a horizontal breakout line on the chart. This makes it easy to spot structural breakouts and take advantage of potential momentum moves.
ZigZag Pro is designed for traders who rely on clean, rule-based market structure — whether you're trading classic breakouts, smart money concepts, or simply want a clearer view of trend shifts. The visuals are minimal, responsive, and suitable for any timeframe.

Enhanced BTC Order Block IndicatorThe script you provided is an "Enhanced BTC Order Block Indicator" written in Pine Script v5 for TradingView. It is designed to identify and visually mark Order Blocks (OBs) on a Bitcoin (BTC) price chart, specifically tailored for a high-frequency scalping strategy on the 5-minute (M5) timeframe. Order Blocks are key price zones where institutional traders are likely to have placed significant buy or sell orders, making them high-probability areas for reversals or continuations. The script incorporates customizable filters, visual indicators, and alert functionality to assist traders in executing the strategy outlined earlier.
Key Features and Functionality
Purpose:
The indicator detects bullish Order Blocks (buy zones) and bearish Order Blocks (sell zones) based on a predefined percentage price movement (default 0.5–1%) and volume confirmation.
It marks these zones on the chart with colored boxes and provides alerts when an OB is detected.
User-Configurable Inputs:
Price Move Range: minMovePercent (default 0.5%) and maxMovePercent (default 1.0%) define the acceptable price movement range for identifying OBs.
Volume Threshold: volumeThreshold (default 1.5x average volume) ensures OB detection is backed by significant trading activity.
Lookback Period: lookback (default 10 candles) determines how many previous candles are analyzed to find the last candle before a strong move.
Wick/Body Option: useWick (default false) allows users to choose whether the OB zone is based on the candle’s wick or body.
Colors: bullishOBColor (default green) and bearishOBColor (default red) set the visual appearance of OB boxes.
Box Extension: boxExtension (default 100 bars) controls how far the OB box extends to the right on the chart.
RSI Filter: useRSI (default true) enables an RSI filter, with rsiLength (default 14), rsiBullishThreshold (default 50), and rsiBearishThreshold (default 50) for trend confirmation.
M15 Support/Resistance: useSR (default true) and srLookback (default 20) integrate M15 timeframe swing highs and lows for additional OB validation.
Core Logic:
Bullish OB Detection: Identifies a strong upward move (0.5–1%) with volume above the threshold. It then looks back to the last bearish candle before the move to define the OB zone. RSI > 50 and proximity to M15 support/resistance (optional) enhance confirmation.
Bearish OB Detection: Identifies a strong downward move (0.5–1%) with volume confirmation, tracing back to the last bullish candle. RSI < 50 and M15 resistance proximity (optional) add validation.
The OB zone is drawn as a rectangle from the high to low of the identified candle, extended rightward.
Visual Output:
Boxes: Uses box.new to draw OB zones, with left set to the previous bar (bar_index ), right extended by boxExtension, top and bottom defined by the OB’s high and low prices. Each box includes a text label ("Bullish OB" or "Bearish OB") and is semi-transparent.
Colors distinguish between bullish (green) and bearish (red) OBs.
Alerts:
Global alertcondition definitions trigger notifications for "Bullish OB Detected" and "Bearish OB Detected" when the respective conditions are met, displaying the current close price in the message.
Helper Functions:
f_priceChangePercent: Calculates the percentage price change between open and close prices.
isNearSR: Checks if the price is within 0.2% of M15 swing highs or lows for support/resistance confluence.
How It Works
The script runs on each candle, evaluating the current price action against the user-defined criteria.
When a bullish or bearish move is detected (meeting the percentage, volume, RSI, and S/R conditions), it identifies the preceding candle to define the OB zone.
The OB is then visualized on the chart, and an alert is triggered if configured in TradingView.
Use Case
This indicator is tailored for your BTC scalping strategy, where trades last 1–15 minutes targeting 0.3–0.5% gains. It helps traders spot institutional order zones on the M5 chart, confirmed by secondary M1 analysis, and integrates with your use of EMAs, RSI, and volume. The customizable settings allow adaptation to varying market conditions or personal preferences.
Limitations
The M15 S/R detection is simplified (using swing highs/lows), which may not always align perfectly with manual support/resistance levels.
Alerts depend on TradingView’s alert system and require manual setup.
Performance may vary with high volatility or low-volume periods, necessitating parameter adjustments.

A.K Dynamic EMA/SMA / MTF S&R Zones Toolkit with AlertsThe A.K Dynamic EMA/SMA / MTF Support & Resistance Zones Toolkit is a powerful all-in-one technical analysis tool designed for traders who want a clean yet comprehensive market view. Whether you're scalping lower timeframes or swing trading higher timeframes, this indicator gives you both the structure and signals to take action with confidence.
Key Features:
✅ Customizable EMA/SMA Suite
Display key Exponential and Simple Moving Averages including 5, 9, 20, 50, 100, and 200 EMAs, plus optional 50 SMA for trend filtering. Each line can be toggled individually and color-customized.
✅ Multi-Timeframe Support & Resistance Zones
Automatically detects dynamic S/R zones on key timeframes (5min, 15min, 30min, 1H, 4H, 1D) using swing highs/lows. Zones are color-coded by strength and whether they're broken or active, providing a clear visual roadmap for price reaction levels.
✅ Zone Strength & Break Detection
Distinguishes between strong and weak zones based on price proximity and reaction depth, with visual shading and automatic label updates when a level is broken.
✅ Price Action-Based Buy/Sell Signals
Generates BUY signals when bullish candles react to strong support (supply) zones, and SELL signals when bearish candles react to strong resistance (demand) zones. All logic is adjustable — including candle body vs wick detection, tolerance range, and strength thresholds.
✅ Alerts Engine
Built-in TradingView alerts for price touching support/resistance or triggering buy/sell signals. Perfect for automation or hands-free monitoring.
✅ Optional Candle & Trend Filters
Highlight bullish/bearish candles visually for additional confirmation.
Optional RSI display and 50-period SMA trend filter to guide directional bias.
🧠 Use Case Scenarios:
Identify dynamic supply & demand zones across multiple timeframes.
Confirm trend direction with EMAs and SMA filters.
React quickly to clean BUY/SELL signals based on actual price interaction with strong zones.
Customize it fully to suit scalping, day trading, or swing trading strategies.
📌 Recommended Settings:
Use default zone transparency (65%) and offset (250 bars) for optimal visual clarity.
Enable alerts to get notified when price enters key S/R levels or when a trade signal occurs.
Combine this tool with your entry/exit plan for better decision-making under pressure.
💡 Pro Tip: Add this indicator to a clean chart and let the zones + EMAs guide your directional bias. Use alerts to avoid screen-watching and improve discipline.
Created by:
Version: Pine Script v6
Platform: TradingView

Order Block with BoSHere’s a professional and concise description you can use for publishing your **TradingView script** titled **"Order Block with BoS"**:
---
### 📌 **Description for TradingView Publication:**
**"Order Block with Break of Structure (BoS)"** is a powerful price action-based indicator designed to identify potential reversal zones and momentum shifts using **Order Block** detection combined with **Break of Structure (BoS)** confirmation.
### 🔍 **Key Features:**
* **Order Block Detection**: Highlights bullish and bearish order blocks using precise candle structure logic.
* **Break of Structure (BoS)**: Confirms structural breaks above swing highs or below swing lows to validate potential trend continuation or reversal.
* **Dynamic ATR Filter**: Uses a 14-period ATR with dynamic thresholds to confirm significant moves, filtering out weak breakouts.
* **Visual Aids**:
* Color-coded **boxes** to mark detected Order Blocks.
* **Arrows** at BoS confirmation points when ATR confirms strong momentum.
* Optional **dashed BoS lines** to show where price broke structure.
### ⚙️ **Customizable Inputs**:
* `Swing Length`: Defines the sensitivity of swing high/low detection.
* `Show Break of Structure`: Toggle on/off BoS confirmation lines.
* `Candle Lookback`: Number of historical candles to consider.
This indicator is ideal for traders who incorporate **smart money concepts**, **market structure analysis**, or **institutional order flow** strategies.
---
Would you like me to help write the **strategy** version of this or translate the description into another language for international audiences?

Stochastic RSI with MTF TableShort Description of the Script
The provided Pine Script indicator, titled "Stochastic RSI with MTF Table," calculates and displays the Stochastic RSI for the current timeframe and multiple other timeframes (5m, 15m, 30m, 60m, 240m, and daily). The Stochastic RSI is a momentum indicator that blends the Relative Strength Index (RSI) and Stochastic Oscillator to identify overbought and oversold conditions, as well as potential trend reversals via K and D line crossovers.
Key features of the script include:
Inputs: Customizable parameters such as K smoothing (default 3), D smoothing (default 3), RSI length (default 14), Stochastic length (default 14), source price (default close), and overbought/oversold levels (default 80/20).
MTF Table: A table displays the Stochastic RSI status for each timeframe:
"OB" (overbought) if K > 80, "OS" (oversold) if K < 20, or "N" (neutral) otherwise.
Crossovers: "K↑D" for bullish (K crosses above D) and "K↓D" for bearish (K crosses below D).
Visualization: Plots the K and D lines for the current timeframe, with horizontal lines at 80 (overbought), 50 (middle), and 20 (oversold), plus a background fill for clarity.
Table Position: Configurable to appear in one of four chart corners (default: top-right).
This indicator helps traders assess momentum across multiple timeframes simultaneously, aiding in the identification of trend strength and potential entry/exit points.
Trading Strategy with 50EMA and 200EMA for Highest Winning Rate
To create a strategy with the best probability of a high winning rate using the Stochastic RSI MTF indicator alongside the 50-period Exponential Moving Average (50EMA) and 200-period Exponential Moving Average (200EMA), we can combine trend identification with momentum-based entry timing. The 50EMA and 200EMA are widely used to determine medium- and long-term trends, while the Stochastic RSI MTF table provides multi-timeframe momentum signals. Here’s the strategy:
1. Determine the Overall Trend
Bullish Trend: The 50EMA is above the 200EMA on the current timeframe (e.g., daily or 60m chart). This suggests an uptrend, often associated with a "Golden Cross."
Bearish Trend: The 50EMA is below the 200EMA on the current timeframe. This indicates a downtrend, often linked to a "Death Cross."
Implementation: Plot the 50EMA and 200EMA on your chart and visually confirm their relative positions.
2. Identify Entry Signals Using the Stochastic RSI MTF Table
In a Bullish Trend (50EMA > 200EMA):
Look for timeframes in the MTF table showing:
Oversold (OS): K < 20, indicating a potential pullback in the uptrend where price may rebound.
Bullish Crossover (K↑D): K crosses above D, signaling rising momentum and a potential entry point.
Example: If the 60m and 240m timeframes show "OS" or "K↑D," this could be a buy signal.
In a Bearish Trend (50EMA < 200EMA):
Look for timeframes in the MTF table showing:
Overbought (OB): K > 80, suggesting a rally in the downtrend where price may reverse downward.
Bearish Crossover (K↓D): K crosses below D, indicating declining momentum and a potential short entry.
Example: If the 30m and daily timeframes show "OB" or "K↓D," this could be a sell/short signal.
Current Timeframe Check: Use the plotted K and D lines on your trading timeframe for precise entry timing (e.g., confirm a K↑D crossover on a 60m chart for a long trade).
3. Confirm Signals Across Multiple Timeframes
Strengthen the Signal: A higher winning rate is more likely when multiple timeframes align with the trend and signal. For instance:
Bullish trend + "OS" or "K↑D" on 60m, 240m, and daily = strong buy signal.
Bearish trend + "OB" or "K↓D" on 15m, 60m, and 240m = strong sell signal.
Prioritize Higher Timeframes: Signals from the 240m or daily timeframe carry more weight due to their indication of broader trends, increasing reliability.
4. Set Stop-Loss and Take-Profit Levels
Long Trades (Bullish):
Stop-Loss: Place below the most recent swing low or below the 50EMA, whichever is closer, to protect against trend reversals.
Take-Profit: Target a key resistance level or use a risk-reward ratio (e.g., 2:1 or 3:1) based on the stop-loss distance.
Short Trades (Bearish):
Stop-Loss: Place above the most recent swing high or above the 50EMA, whichever is closer.
Take-Profit: Target a key support level or apply a similar risk-reward ratio.
Trailing Stop Option: As the trend progresses, trail the stop below the 50EMA (for longs) or above it (for shorts) to lock in profits.
5. Risk Management
Position Sizing: Risk no more than 1-2% of your trading capital per trade to minimize losses from false signals.
Volatility Consideration: Adjust stop-loss distances and position sizes based on the asset’s volatility (e.g., wider stops for volatile stocks or crypto).
Avoid Overtrading: Wait for clear alignment between the EMA trend and MTF signals to avoid low-probability setups.
Example Scenario
Chart: 60-minute timeframe.
Trend: 50EMA > 200EMA (bullish).
MTF Table: 60m shows "OS," 240m shows "K↑D," and daily is "N."
Action: Enter a long position when the 60m K line crosses above D, confirming the table signal.
Stop-Loss: Below the recent 60m swing low (e.g., 2% below entry).
Take-Profit: At the next resistance level or a 3:1 reward-to-risk ratio.
Outcome: High probability of success due to trend alignment and multi-timeframe confirmation.
Why This Strategy Works
Trend Following: Trading in the direction of the 50EMA/200EMA trend reduces the risk of fighting the market’s momentum.
Momentum Timing: The Stochastic RSI MTF table pinpoints pullbacks or reversals within the trend, improving entry timing.
Multi-Timeframe Confirmation: Alignment across timeframes filters out noise, increasing the win rate.
Risk Control: Defined stop-loss and position sizing protect against inevitable losses.
Caveats
No strategy guarantees a 100% win rate; false signals can occur, especially in choppy markets.
Test this strategy on historical data or a demo account to verify its effectiveness for your asset and timeframe.
This approach leverages the strengths of both trend-following (EMA) and momentum (Stochastic RSI) tools, aiming for a high-probability, disciplined trading system.

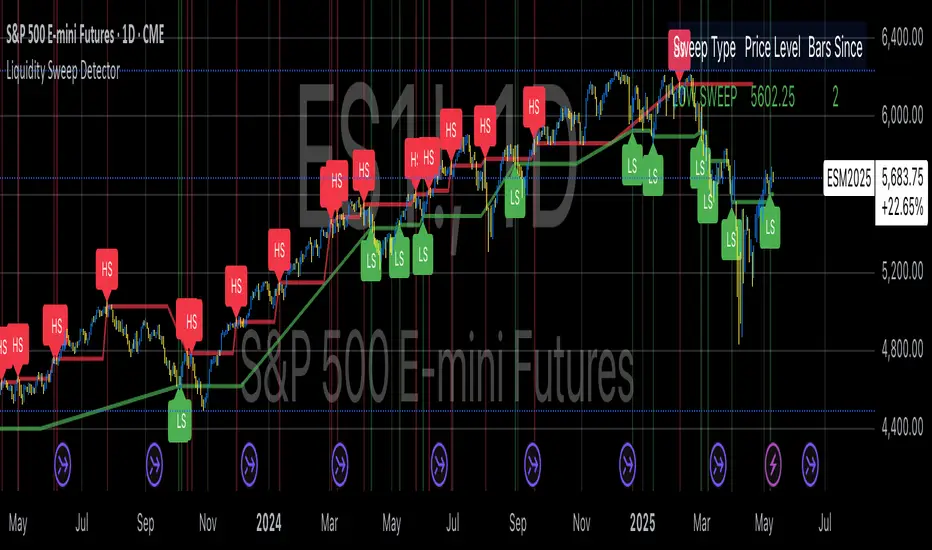
Liquidity Sweep DetectorThe Liquidity Sweep Detector represents a technical analysis tool specifically designed to identify market microstructure patterns typically associated with institutional trading activity. According to Harris (2003), institutional traders frequently employ tactics where they momentarily break through price levels to trigger stop orders before redirecting the market in the opposite direction. This phenomenon, commonly referred to as "stop hunting" or "liquidity sweeping," constitutes a significant aspect of institutional order flow analysis (Osler, 2003). The current implementation provides retail traders with a means to identify these patterns, potentially aligning their trading decisions with institutional movements rather than becoming victims of such strategies.
Osler's (2003) research documents how stop-loss orders tend to cluster around significant price levels, creating concentrations of liquidity. Taylor (2005) argues that sophisticated institutional participants systematically exploit these liquidity clusters by inducing price movements that trigger these orders, subsequently profiting from the ensuing price reaction. The algorithmic detection of such patterns involves several key processes. First, the indicator identifies swing points—local maxima and minima—through comparison with historical price data within a definable lookback period. These swing points correspond to what Bulkowski (2011) describes as "significant pivot points" that frequently serve as liquidity zones where stop orders accumulate.
The core detection algorithm utilizes a multi-stage process to identify potential sweeps. For high sweeps, it monitors when price exceeds a previous swing high by a specified threshold percentage, followed by a bearish candle that closes below the original swing high level. Conversely, for low sweeps, it detects when price drops below a previous swing low by the threshold percentage, followed by a bullish candle closing above the original swing low. As noted by Lo and MacKinlay (2011), these price patterns often emerge when large institutional players attempt to capture liquidity before initiating significant directional moves.
The indicator maintains historical arrays of detected sweep events with their corresponding timestamps, enabling temporal analysis of market behavior following such events. Visual elements include horizontal lines marking sweep levels, background color highlighting for sweep events, and an information table displaying active sweeps with their corresponding price levels and elapsed time since detection. This visualization approach allows traders to quickly identify potential institutional activity without requiring complex interpretation of raw price data.
Parameter customization includes adjustable lookback periods for swing point identification, sweep threshold percentages for signal sensitivity, and display duration settings. These parameters allow traders to adapt the indicator to various market conditions and timeframes, as markets demonstrate different liquidity characteristics across instruments and periods (Madhavan, 2000).
Empirical studies by Easley et al. (2012) suggest that retail traders who successfully identify and act upon institutional liquidity sweeps may achieve superior risk-adjusted returns compared to conventional technical analysis approaches. However, as cautioned by Chordia et al. (2008), such patterns should be considered within broader market context rather than in isolation, as their predictive value varies significantly with overall market volatility and liquidity conditions.
References:
Bulkowski, T. (2011). Encyclopedia of Chart Patterns (2nd ed.). John Wiley & Sons.
Chordia, T., Roll, R., & Subrahmanyam, A. (2008). Liquidity and market efficiency. Journal of Financial Economics, 87(2), 249-268.
Easley, D., López de Prado, M., & O'Hara, M. (2012). Flow Toxicity and Liquidity in a High-frequency World. The Review of Financial Studies, 25(5), 1457-1493.
Harris, L. (2003). Trading and Exchanges: Market Microstructure for Practitioners. Oxford University Press.
Lo, A. W., & MacKinlay, A. C. (2011). A Non-Random Walk Down Wall Street. Princeton University Press.
Madhavan, A. (2000). Market microstructure: A survey. Journal of Financial Markets, 3(3), 205-258.
Osler, C. L. (2003). Currency Orders and Exchange Rate Dynamics: An Explanation for the Predictive Success of Technical Analysis. Journal of Finance, 58(5), 1791-1820.
Taylor, M. P. (2005). Official Foreign Exchange Intervention as a Coordinating Signal in the Dollar-Yen Market. Pacific Economic Review, 10(1), 73-82.
Vietnamese Market Structure With CountersThis indicator is designed to track Market Structure with Swing-Low Breakdowns and Swing-High Breakups specifically tailored for the Vietnamese stock market, though it can be applied elsewhere too. By default, it uses a 10-period EMA to dynamically detect key turning points in price action and count significant breakdowns or breakups from previous swing levels.
As an open source, you can modify the source code to match your needs.
What it does:
Detects when price breaks below previous swing lows or above previous swing highs.
Plots swing levels for both highs and lows.
Displays labeled counters on the chart to show how many consecutive breakdowns or breakups have occurred.
Helps traders identify trend shifts and possible exhaustion in moves.
Why it's useful:
This tool is great for visually tracking market momentum and structure changes — especially in trending or volatile environments. It emphasizes structure over indicators, helping you understand price behavior in a simplified, intuitive way.
License:
This script is published under the Mozilla Public License 2.0. Feel free to use, modify, and contribute!
Created with care by @doqkhanh.
If you find it useful, consider leaving a comment or sharing it with others!

Rawstocks 15 Minute ModelRawstocks 15-Minute Model
The Rawstocks 15-Minute Model is a precision intraday trading strategy designed for the US stock market (9:30 AM - 4:00 PM ET), optimized for the 15-minute timeframe. It combines institutional order flow concepts with Fibonacci retracements to identify high-probability reversal setups while enforcing strict risk management and session-based rules.
Key Features
Time-Based Execution
Trading Hours: 9:30 AM - 4:00 PM ET (no new entries after 4:00 PM)
Force Close: All positions auto-exit at 4:30 PM ET (prevents overnight risk)
Entry Logic
Order Block + Fib Confluence:
Identifies institutional order blocks (previous swing highs/lows)
Requires price pullback to 61.8% or 79% Fibonacci level
Liquidity Confirmation:
Waits for stop runs (liquidity sweeps) before reversal entries
Exit Rules
Stop Loss: 1x ATR (14) from entry
Take Profit: 2:1 Risk-Reward (adjustable)
Visual Signals
Green Triangle: Valid long setup (pullback to bullish OB + Fib)
Red Triangle: Valid short setup (pullback to bearish OB + Fib)
Blue/Purple Background: Highlights active trading vs. close period
How It Works
Identify the Setup
Wait for a strong impulse move (break of structure)
Mark the order block (institutional zone)
Confirm Pullback
Price must retrace to 61.8% or 79% Fib level
Must occur within trading hours (9:30 AM - 4:00 PM)
Enter on Confirmation
Long: Break of pullback candle high (stop below recent swing low)
Short: Break of pullback candle low (stop above recent swing high)
Manage the Trade
Trail stop or exit at 2R (risk-to-reward)
All positions close at 4:30 PM sharp

Liquidity Trap Reversal Pro (Radar v2)Liquidity Trap Reversal Pro (Radar v2) is a non-repainting indicator designed to detect hidden liquidity traps at key swing highs and lows. It combines wick analysis, volume spike detection, and optional trend and exhaustion filters to identify high-probability reversal setups.
🔷 Features:
Non-Repainting: Pivots confirmed after lookback period, no future leaking.
Volume Spike Detection: Filters traps that occur during major liquidity events.
EMA Trend Filter (Optional): Focus on traps aligned with the prevailing trend.
Higher Timeframe Trend Filter (Optional): Confirm traps using a higher timeframe EMA bias.
Exhaustion Guard (Optional): Prevents traps after overextended moves based on ATR stretch.
Clean Visuals: Distinct plots for raw trap points vs confirmed traps.
Alerts Included: Set alerts for confirmed high/low liquidity traps.
📚 How to Use:
Watch for Trap Signals:
A Trap High signal suggests a potential bearish reversal.
A Trap Low signal suggests a potential bullish reversal.
Use Confirmed Signals for Best Entries:
Confirmed traps fire only after price moves opposite to the trap direction, adding reliability.
Use Trend Filters to Improve Accuracy:
In an uptrend (price above EMA), prefer Trap Lows (buy setups).
In a downtrend (price below EMA), prefer Trap Highs (sell setups).
Use the Exhaustion Guard to Avoid Bad Trades:
This filter blocks signals when price has moved too far from trend, helping avoid late entries.
Recommended Settings:
Best used on 15-minute, 1-hour, or 4-hour charts.
Trend filter ON for trending markets.
Exhaustion guard ON for volatile or stretched markets.
📈 Important Notes:
This script does not repaint once a pivot is confirmed.
Alerts trigger only on confirmed trap signals.
Always combine signals with sound risk management and trading strategy.
Disclaimer:
This script is for educational purposes only. It is not investment advice or a guarantee of results. Always do your own research before trading.

Whale Psychology Insights
### 🧠 Whale Psychology Insights – Unmasking Smart Money Moves
**Understand the mind games behind every candle.**
This advanced indicator is designed to reveal the psychological warfare played by whales and market manipulators in the crypto space. Stop trading blind—start trading with the insights of the smart money.
#### 🔍 What It Does:
- **Liquidity Zone Detection** – Automatically identifies key **swing highs/lows** where stop hunts are likely.
- **Volume Spike Alerts** – Spot **suspicious activity** where big players enter or exit.
- **Order Block Zones** – Highlights **bullish/bearish engulfing patterns** used by institutions.
- **Fair Value Gaps (FVG)** – Marks price inefficiencies where price may return.
- **Fakeout Detection** – Finds **manipulative wicks** designed to trap retail traders.
#### 💡 Use Cases:
- Avoid getting stopped out by **liquidity grabs**
- Enter after the **whales have made their move**
- Identify **high-probability reversal zones**
- Trade **with smart money**, not against it
Perfect for scalpers, intraday traders, and swing traders looking to understand *why* price moves—not just *where*.
> 🧠 **Trade the psychology, not just the chart.**

SMC Entry Signals MTF v2📘 User Guide for the SMC Entry Signals MTF v2 Indicator
🎯 Purpose of the Indicator
This indicator is designed to identify reversal entry points based on Smart Money Concepts (SMC) and candlestick confirmation. It’s especially useful for traders who use:
Imbalance zones, order blocks, breaker blocks
Liquidity grabs
Multi-timeframe confirmation (MTF)
📈 How to Use the Signals on the Chart
✅ LONG Signal (green triangle below the candle):
Conditions:
Price is in a discount zone (below the FIB 50% level)
A bullish engulfing candle appears
A bullish Order Block (OB) or Breaker Block is detected
There’s an upward imbalance
A bullish OB is confirmed on the higher timeframe
➡️ How to act:
Consider entering long on the current or next candle.
Place your stop-loss below the OB or the nearest swing low.
Take profit at the nearest liquidity zone or premium area (above FIB 50%).
🔻 SHORT Signal (red triangle above the candle):
Conditions:
Price is in a premium zone (above FIB 50%)
A bearish engulfing candle appears
A bearish OB or Breaker Block is detected
There’s a downward imbalance
A bearish OB is confirmed on the higher timeframe
➡️ How to act:
Consider short entry after the signal.
Place your stop-loss above the OB or swing high.
Target the discount zone or the next liquidity pocket.
⚙️ Recommended Settings by Trading Style
Trading Style Suggested Settings Notes
Intraday (1–15m) fibLookback = 20–50, obLookback = 5–10, htf_tf = 1H/4H Fast signals. Use Discount/Premium + Engulfing.
Swing/Position (1H–1D) fibLookback = 50–100, obLookback = 10–20, htf_tf = 1D/1W Higher trust in MTF confirmation. Ideal with fundamentals.
Scalping (1m) fibLookback = 10–20, obLookback = 3–5, htf_tf = 15m/1H Remove Breaker and MTF for quick reaction trades.
🧠 Best Practices for Traders
Trend Filtering:
Use EMAs or volume to confirm the current trend.
Take longs only in uptrends, shorts in downtrends.
Liquidity Zones:
Use this indicator after liquidity grabs.
OBs and Breakers often appear right after stop hunts.
Combine with Manual Zones:
This works best when paired with manually drawn OBs and key levels.
Backtest the Signals:
Use Bar Replay mode on TradingView to test past signals.
🧪 Example Trade Setup
Example on BTCUSDT 15m:
Price drops into the discount zone.
A green triangle appears (bullish engulfing + OB + imbalance + HTF OB).
You enter long, stop below the OB, target the premium zone.
🎯 This type of setup often gives a risk/reward ratio of 1:2 or better — profitable even with a 40% win rate.
⏰ Alerts & Automation
Enable alerts:
"SMC Long Entry" — fires when a long signal appears.
"SMC Short Entry" — fires when a short signal appears.
You can integrate this with bots via webhook, like:
TradingConnector, 3Commas, Alertatron, etc.
✅ What This Indicator Gives You
High-probability entries using SMC logic
Customizable filters for entry logic
Multi-timeframe confirmation for stronger setups
Suitable for both intraday and swing trading

ICT Turtle Soup (Liquidity Reversal)ICT Turtle Soup — Liquidity Reversal Detection
Trap the Trap: A Precision Reversal Strategy from the Inner Circle Trader Playbook
This indicator implements the Turtle Soup liquidity reversal setup — a widely used ICT (Inner Circle Trader) concept that targets false breakouts beyond recent swing highs or lows. These patterns typically occur when price grabs liquidity above or below a known level, then snaps back, trapping retail traders and creating a high-probability reversal scenario.
🔍 What This Script Does:
Detects Liquidity Sweeps Above/Below Key Swing Levels
Uses a customizable swing lookback to identify recent swing highs and lows.
Triggers a Bearish Turtle Soup when price runs above a previous swing high and closes back below.
Triggers a Bullish Turtle Soup when price sweeps below a prior swing low and closes back above.
Plots Clear Visual Signals
Reversal signals appear as 🐢🔻 (Bearish) or 🐢🔺 (Bullish) markers directly on your chart.
Optional labels can be enabled for enhanced journaling and review.
Real-Time Alerts
Receive alert notifications when a Turtle Soup setup is detected — ideal for scalpers or intraday traders watching for reversals around liquidity pools.
⚙️ Customization Options:
Set the swing lookback sensitivity (default: 5)
Enable or disable labels
Choose label font size
Customize colors for bullish and bearish signals
💡 How to Use:
Deploy on intraday timeframes (e.g. 5m–15m) for high-resolution liquidity analysis.
Watch for signals at key highs/lows, session extremes, or zones where liquidity is likely resting.
Combine with tools like FVGs, Order Blocks, and OTE zones for layered confirmation.
🔗 Combine With These Tools for a Complete SMC Edge:
✅ First FVG — Opening Range Fair Value Gap Detector
✅ ICT SMC Liquidity Grabs + OB + Fibonacci OTE Levels
✅ Liquidity Levels — Smart Swing Lows
Together, these tools form a high-precision Smart Money toolkit — helping traders map, anticipate, and act on institutional-level liquidity events with clarity and confidence.

ICT Turtle Soup Ultimate V2📜 ICT Turtle Soup Ultimate V2 — Advanced Liquidity Reversal System
Overview:
The ICT Turtle Soup Ultimate V2 is a next-generation liquidity reversal indicator built on the principles of smart money concepts (SMC) and the classic ICT Turtle Soup setup. It is designed to detect false breakouts (liquidity grabs) at key swing points, enhanced by proprietary logic that filters out low-quality signals using a combination of trend context, kill zone timing, candle wick behavior, and multi-timeframe imbalance zones.
This tool is ideal for intraday traders seeking high-probability entry signals near liquidity pools and imbalance zones — where smart money makes its move.
🔍 What This Script Does
🧠 Liquidity Grab Detection (Turtle Soup Core Logic)
The script scans for recent swing highs/lows using a user-defined lookback.
A signal is generated when price breaks above/below a previous swing level but closes back inside — indicating a liquidity run and likely reversal.
A special Wick Trap Mode enhances this logic by detecting long-wick fakeouts — where the wick grabs stops but the candle body closes opposite the breakout direction.
📉 Trend Filter with ATR Buffer
Optional trend filter uses a simple moving average (SMA) to gauge market direction.
Instead of hard filtering, it applies an ATR-based buffer to allow for entries near the trend line, reducing signal suppression from micro-fluctuations.
🕰️ Kill Zone Session Filtering
Only show signals during institutional trading hours:
London Session
New York AM
Or any custom user-defined session
Helps traders avoid low-volume hours and focus on where stop hunts and price expansions typically occur.
🧱 Multi-Timeframe FVG Confluence (Optional)
Signal validation is strengthened by checking if price is within a higher timeframe Fair Value Gap — commonly used to identify imbalances or inefficiencies.
Filters out setups that lack underlying displacement or order flow justification.
🎨 Visual Feedback
Plots 🔺 bullish and 🔻 bearish markers at signal candles.
Optionally displays:
Swing High/Low Labels (SH / SL)
Reversal distance labels
Background color shading on valid signals
Includes built-in alerts for automated trade notification.
🔑 Unique Benefits
Wick Trap Detection: A proprietary approach to detecting stop hunts via wick behavior, not just candle closes.
ATR-based trend filtering: Avoids unnecessary filtering while still maintaining directional bias.
All-in-one system: No need to stack multiple indicators — swing detection, reversal logic, session filtering, and imbalance confirmation are all integrated.
💡 How to Use
Enable Wick Trap Mode to detect stealthy liquidity grabs with strong wicks.
Use Kill Zone filters to trade only when institutions are active.
Optionally enable FVG confluence to improve confidence in reversal zones.
Watch for Bullish signals near SL levels and Bearish signals near SH levels.
Combine with your own execution strategy or other SMC tools for optimal results.
🔗 Best Used With:
Maximize your edge by combining this script with complementary SMC-based tools:
✅ First FVG — Opening Range Fair Value Gap Detector
✅ ICT SMC Liquidity Grabs + OB + Fibonacci OTE Levels
✅ Liquidity Levels — Smart Swing Highs and Lows with horizontal line projections

ICT Turtle Soup (Liquidity Reversal)ICT Turtle Soup — Liquidity Reversal Detection
Classic Liquidity Trap Reversal Strategy for Smart Money Traders
This indicator implements the ICT Turtle Soup concept — a classic liquidity-based reversal pattern — which occurs when price runs above or below a recent swing level to grab liquidity, then sharply reverses. This pattern is commonly used in Smart Money Concepts (SMC) and Inner Circle Trader (ICT) strategies to anticipate false breakouts and high-probability reversals.
🔍 What This Script Does:
Identifies Swing Highs & Lows
Detects recent swing highs and lows using a customizable lookback period.
Tracks Liquidity Grabs
A bearish Turtle Soup setup is triggered when price breaks above a recent swing high but closes back below it.
A bullish Turtle Soup setup is triggered when price breaks below a recent swing low but closes back above it.
These conditions often signal liquidity traps, where price sweeps resting orders before reversing.
Plots Signals Directly on the Chart
Turtle Soup setups are marked with 🐢🔻 (bearish) and 🐢🔺 (bullish) labels.
Optional full-text labels can also be displayed for clarity and journaling.
Includes Alert Conditions
Alerts can be enabled to notify you of bullish or bearish Turtle Soup reversals in real-time.
⚙️ Customization Features:
Adjustable swing lookback period
Enable/disable Turtle Soup labels
Set label font size
Choose your preferred bullish/bearish signal colors
💡 How to Use:
Add this script to your chart (ideally on intraday timeframes such as 5m–15m).
Wait for a Turtle Soup signal near a key swing high/low or liquidity zone.
Combine with other confirmation tools (e.g., FVGs, Order Blocks, OTE) for stronger setups.
Use alerts to stay ahead of fast-moving reversals.
🧠 Why It Works:
Turtle Soup setups are rooted in liquidity theory — they exploit the market’s tendency to sweep obvious swing levels before reversing. These moves often trap retail traders and mark the beginning of Smart Money entries.
🔗 Best Used With:
Maximize the edge by combining this with other SMC tools:
✅ First FVG — Opening Range Fair Value Gap Detector
✅ ICT SMC Liquidity Grabs + OB + Fibonacci OTE Levels
✅ Liquidity Levels — Smart Swing Lows
Together, they create a complete ecosystem for identifying, confirming, and executing liquidity-driven trade setups with precision.

Auto Support Resistance Channels [TradingFinder] Top/Down Signal🔵 Introduction
In technical analysis, a price channel is one of the most widely used tools for identifying and tracking price trends. A price channel consists of two parallel trendlines, typically drawn from swing highs (resistance) and swing lows (support). These lines define dynamic support and resistance zones and provide a clear framework for interpreting price fluctuations.
Drawing a channel on a price chart allows the analyst to more precisely identify entry points, exit levels, take-profit zones, and stop-loss areas based on how the price behaves within the boundaries of the channel.
Price channels in technical analysis are generally categorized into three types: upward channels with a positive slope, downward channels with a negative slope, and horizontal (range-bound) channels with near-zero slope. Each type offers unique insights into market behavior depending on the price structure and prevailing trend.
Structurally, channels can be formed using either minor or major pivot points. A major channel typically reflects a stronger, more reliable structure that appears on higher timeframes, whereas a minor channel often captures short-term fluctuations or corrective movements within a larger trend.
For instance, a major downward channel may indicate sustained selling pressure across the market, while a minor upward channel could represent a temporary pullback within a broader bearish trend.
The validity of a price channel depends on several factors, including the number of price touches on the channel lines, the symmetry and parallelism of the trendlines, the duration of price movement within the channel, and price behavior around the median line.
When a price channel is broken, it is generally expected that the price will move in the breakout direction by at least the width of the channel. This makes price channels especially useful in breakout analysis.
In the following sections, we will explore the different types of price channels, how to draw them accurately, the structural differences between minor and major channels, and key trade interpretations when price interacts with channel boundaries.
Up Channel :
Down Channel :
🔵 How to Use
A price channel is a practical tool in technical analysis for identifying areas of support, resistance, trend direction, and potential breakout zones. The structure consists of two parallel trendlines within which price fluctuates.
Traders use the relative position of price within the channel to make informed trading decisions. The two primary strategies include range-based trades (buying low, selling high) and breakout trades (entering when price exits the channel).
🟣 Up Channel
In an upward channel, price moves within a positively sloped range. The lower trendline acts as dynamic support, while the upper trendline serves as dynamic resistance. A common strategy involves buying near the lower support and taking profit or selling near the upper resistance.
If price breaks below the lower trendline with strong volume or a decisive candle, it can signal a potential trend reversal. Channels constructed from major pivots generally reflect dominant uptrends, while those based on minor pivots are often corrective structures within a broader bearish movement.
🟣 Down Channel
In a downward channel, price moves between two negatively sloped lines. The upper trendline functions as resistance, and the lower trendline as support. Ideal entry for short trades occurs near the upper boundary, especially when confirmed by bearish price action or a resistance level.
Exit targets are typically located near the lower support. If the upper boundary is broken to the upside, it may be an early sign of a bullish trend reversal. Like upward channels, a major down channel represents broader selling pressure, while a minor one may indicate a brief retracement in a bullish move.
🟣 Range Channel
A horizontal or range-bound channel is characterized by price oscillating between two nearly flat lines. This type of channel typically appears during sideways markets or periods of consolidation.
Traders often buy near the lower boundary and sell near the upper boundary to take advantage of contained volatility. However, fake breakouts are more frequent in range-bound structures, so it is important to wait for confirmation through candlestick signals and volume. A confirmed breakout beyond the channel boundaries can justify entering a trade in the direction of the breakout.
🔵 Settings
Pivot Period :This parameter defines how sensitive the channel detection is. A higher value causes the algorithm to identify major pivot points, resulting in broader and longer-term channels. Lower values focus on minor pivots and create tighter, short-term channels.
🔔 Alerts
Alert Configuration :
Enable or disable the full alert system
Set a custom alert name
Choose the alert frequency: every time, once per bar, or on bar close
Define the time zone for alert timestamps (e.g., UTC)
Channel Alert Types :
Each channel type (Major/Minor, Internal/External, Up/Down) supports two alert types :
Break Alert : Triggered when price breaks above or below the channel boundaries
React Alert : Triggered when price touches and reacts (bounces) off the channel boundary
🎨 Display Settings
For each of the eight channel types, you can customize:
Visibility : show or hide the channel
Auto-delete previous channels when new ones are drawn
Style : line color, thickness, type (solid, dashed, dotted), extension (right only, both sides)
🔵 Conclusion
The price channel is a foundational structure in technical analysis that enables traders to analyze price movement, identify dynamic support and resistance zones, and locate potential entry and exit points with greater precision.
When constructed properly using minor or major pivots, a price channel offers a consistent and intuitive framework for interpreting market behavior—often simpler and more visually clear than many other technical tools.
Understanding the differences between upward, downward, and range-bound channels—as well as recognizing the distinctions between minor and major structures—is critical for selecting the right trading strategy. Upward channels tend to generate buying opportunities, downward channels prioritize short setups, and horizontal channels provide setups for both mean-reversion and breakout trades.
Ultimately, the reliability of a price channel depends on various factors such as the number of touchpoints, the duration of the channel, the parallelism of the lines, and how the price reacts to the median line.
By taking these factors into account, an experienced analyst can effectively use price channels as a powerful tool for trend forecasting and precise trade execution. Although conceptually simple, successful application of price channels requires practice, pattern recognition, and the ability to filter out market noise.

Dynamic Volume Profile PoC SwiftedgeOverview
The Dynamic Volume Profile PoC is a powerful and visually intuitive indicator designed to help traders identify key support and resistance levels using a unique combination of pivot points, volume analysis, and dynamic Point of Control (PoC) levels. This script overlays directly on your chart, providing clear visual cues for potential breakout and rejection zones, making it easier to spot high-probability trading opportunities.
What It Does
This indicator combines three core components to deliver actionable insights:
Pivot Points: Identifies significant swing highs and lows to establish potential support and resistance levels.
Volume Oscillator: Measures volume momentum to confirm the strength of price movements, ensuring that breakouts or rejections are backed by significant volume.
Dynamic Point of Control (PoC): Calculates the midpoint between consecutive pivot points to create dynamic PoC levels, which act as key areas where price is likely to either break through (breakout) or reverse (rejection).
These components work together to highlight critical price levels where the market is likely to react, giving traders a clear framework for decision-making.
How It Works
Pivot Detection: The script uses pivot highs and lows (based on user-defined Left Bars and Right Bars) to identify significant price levels. These pivots form the foundation for calculating PoC levels.
PoC Calculation: Each time a new pivot is detected, the script calculates the midpoint between the current pivot and the previous pivot, creating a dynamic PoC level. These levels are plotted as horizontal lines on the chart, with a maximum of Max PoC Lines to Show (default: 2) visible at any time.
Volume Confirmation: A volume oscillator (short EMA of volume minus long EMA of volume) is used to filter breakouts and rejections. Breakouts or rejections are only signaled if the volume oscillator exceeds the Volume Threshold (default: 20), ensuring that price movements are supported by strong volume.
Visual Cues:
PoC levels are drawn as cyan lines with optional semi-transparent zones (controlled by Show PoC Zones). These zones are colored green for potential breakouts (price above PoC) and red for potential rejections (price below PoC).
Labels above and below each PoC level indicate trading opportunities: "Long if breakout"/"Long if rejected" (green) and "Short if breakout"/"Short if rejected" (red), depending on the price's direction relative to the PoC.
Break signals ("B") are plotted above or below bars when price crosses a pivot level with sufficient volume, colored red for downward breaks and green for upward breaks.
How to Use
Add the Indicator: Add the "Dynamic Volume Profile PoC " to your chart in TradingView.
Adjust Settings:
Left Bars and Right Bars (default: 15): Control the sensitivity of pivot detection. Lower values make the script more sensitive to smaller price swings.
Volume Threshold (default: 20): Set the minimum volume oscillator value required to confirm breakouts or rejections. Increase this for stricter confirmation.
Max PoC Lines to Show (default: 2): Define how many PoC levels are displayed at once.
Show PoC Zones (default: true): Toggle semi-transparent zones around PoC levels for better visualization.
Label Spacing Factor (default: 0.5): Adjust the vertical spacing between labels and the PoC box. Increase this value (e.g., to 1.0 or 2.0) for more spacing, or decrease it (e.g., to 0.3) for less.
Interpret the Signals:
Look for PoC levels (cyan lines) as key areas of interest.
Use the labels to identify potential trades: "Long if breakout" indicates a buy opportunity if price breaks above the PoC, while "Short if rejected" suggests a sell if price fails to break through.
Watch for "B" signals to confirm breakouts or rejections with volume support.
Combine with Your Strategy: Use the PoC levels and break signals as part of your broader trading strategy, such as trend-following or mean-reversion setups.
Why This Script is Unique
The Dynamic Volume Profile PoC stands out by combining pivot points, volume analysis, and dynamic PoC levels into a single, cohesive tool. Unlike traditional volume profile indicators that require a fixed range, this script dynamically updates PoC levels based on recent price action, making it more responsive to current market conditions. The addition of volume confirmation ensures that signals are backed by market participation, reducing false breakouts. The visually appealing design, with customizable spacing and semi-transparent zones, makes it easy to interpret key levels at a glance, even for traders unfamiliar with Pine Script.
Notes
This script works best on timeframes where pivot points are meaningful (e.g., 1H, 4H, or daily charts).
Adjust the Label Spacing Factor to ensure labels are well-spaced for your chart's zoom level and instrument.
For instruments with high volatility, you may need to increase the Volume Threshold to filter out noise.
